Forex trading can seem like a complex and daunting task for those new to the world of investing. But, with the right knowledge and tools, you can learn to navigate the markets and make successful trades. One important tool to use is the Forex chart. With a Forex chart, you can track currency movements in real-time, and make more informed decisions when trading.
In this article, we'll show you how to read a Forex chart and understand the data it provides, so that you can take your trading to the next level. One of the most important skills for successful Forex trading is understanding how to read a Forex chart. This tutorial will cover the basics of currency pair pricing, different types of Forex charts, and how to interpret different types of Forex charts. With this guide, you'll be able to start reading and understanding Forex charts in no time!What is a Forex Chart? A Forex chart is a graphical representation of the price movements of a particular currency pair. It shows the price of one currency against another over a period of time.
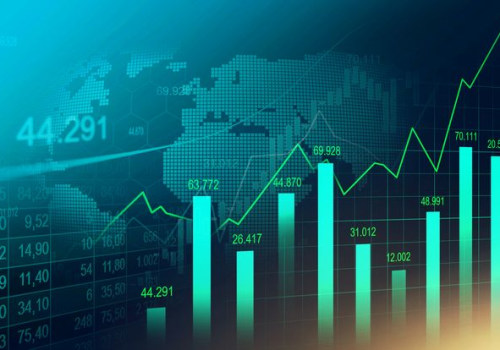
The chart is typically displayed in the form of a line, bar, or candlestick chart. What is a Currency Pair? A currency pair is two currencies that are traded against each other in the foreign exchange market. For example, if you were trading the EUR/USD currency pair, you would be buying euros and selling US dollars. How to Read a Line Chart? A line chart shows the price movement of a currency pair in a linear format over a specific period of time. The vertical axis (Y-axis) displays the price of the currency pair, while the horizontal axis (X-axis) displays the time frame. How to Read a Bar Chart? A bar chart shows the high and low prices for a given currency pair over a specific period of time. The vertical axis (Y-axis) displays the price of the currency pair, while the horizontal axis (X-axis) displays the time frame.
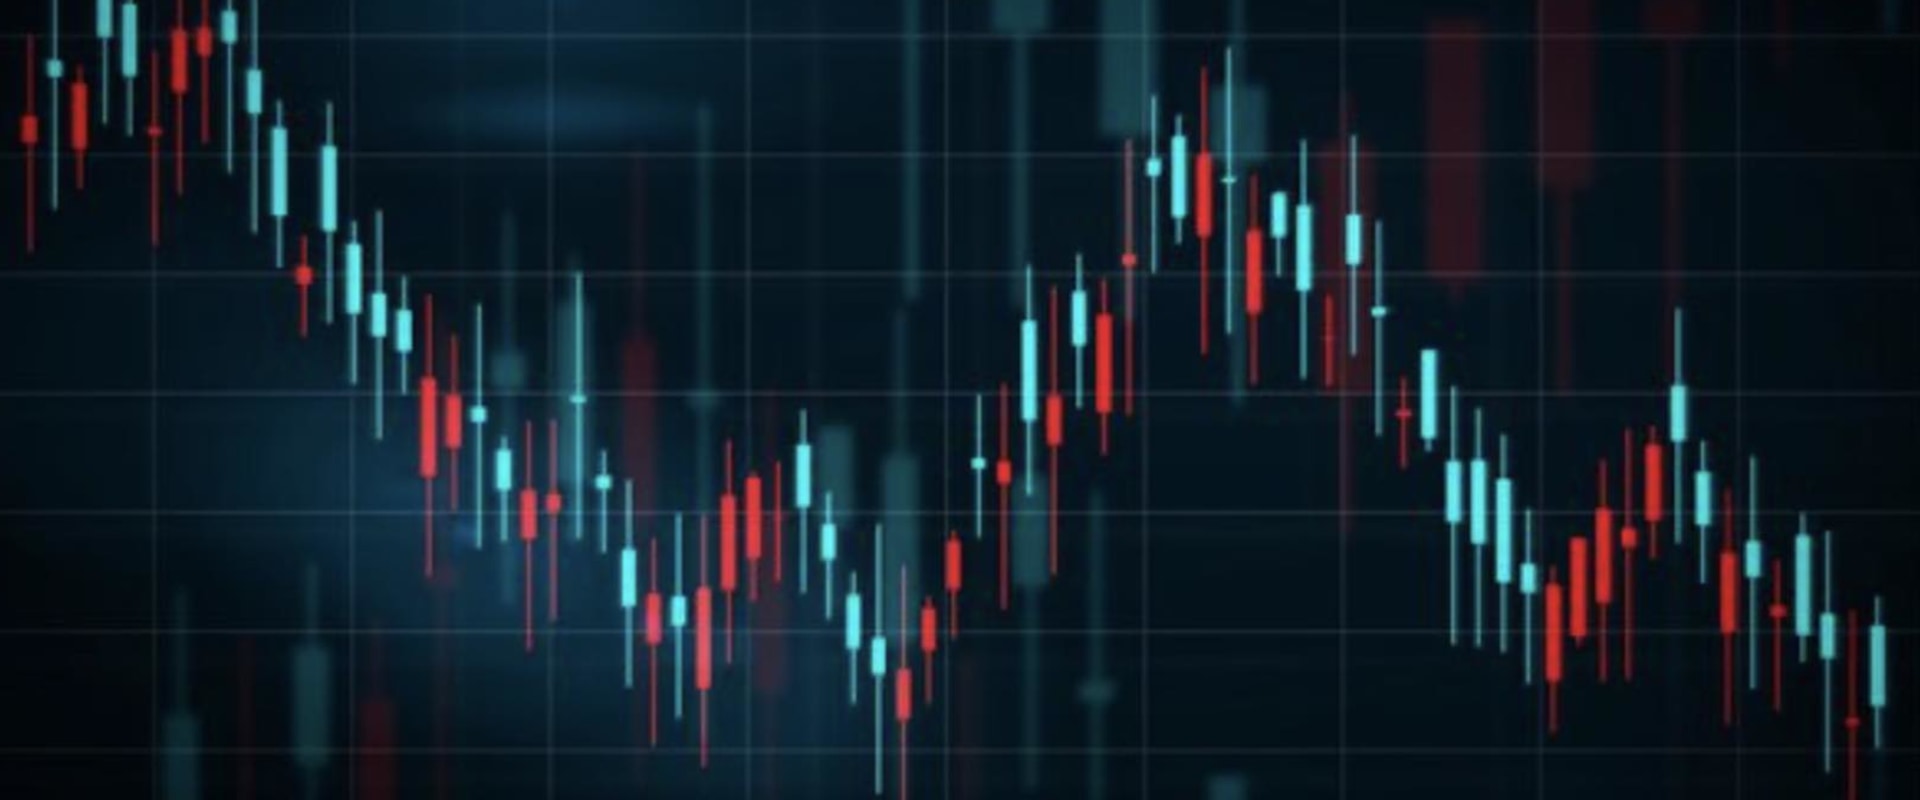
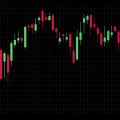
The high price is represented by the top of the bar, while the low price is represented by the bottom of the bar. How to Read a Candlestick Chart? A candlestick chart shows the open, high, low, and close prices for a given currency pair over a specific period of time. Each candle on the chart is made up of four parts: an upper wick, lower wick, body, and shadows. The upper wick indicates where the high price was reached during that period, while the lower wick indicates where the low price was reached during that period. The body shows where the open and close prices were during that period, while the shadows indicate where prices were outside of those boundaries.
Different Types of Forex Charts
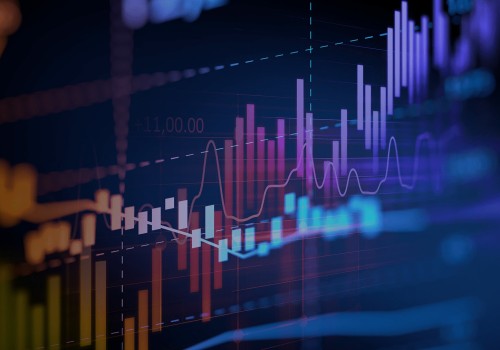
When it comes to understanding how to read a Forex chart, one of the most important skills for successful trading is recognizing the different types of charts available.Line charts, bar charts, and candlestick charts are all used in Forex trading, and each has its own purpose. Line charts are the most basic type of Forex chart. They are used to track price movements over a given period of time. Line charts show a single line that connects the closing prices for each period, showing traders the overall trend in the currency pair's price.
Bar charts are slightly more detailed than line charts as they provide a visual representation of the open, close, high, and low prices for each period. This allows traders to identify the range of prices for a currency pair during a given period of time. Candlestick charts are the most popular type of Forex chart among traders. Candlestick charts are similar to bar charts but provide more detail regarding the open, close, high, and low prices for each period.
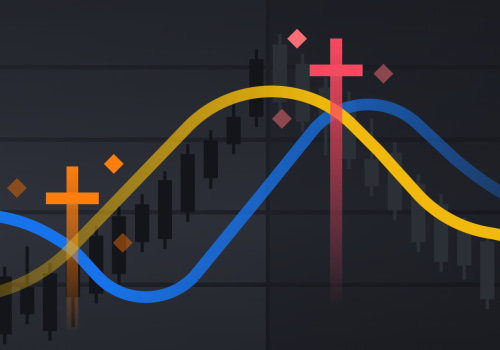
Each ‘candle’ in the chart represents the currency pair’s price range during a given period of time and can be used to identify possible trend reversals. By understanding different types of Forex charts and how they are used in trading, you will be well on your way to reading and interpreting Forex charts like a pro. Reading and understanding Forex charts is an important part of successful trading in the foreign exchange market. With this tutorial as your guide, you'll be able to start reading and interpreting Forex charts in no time! Understanding how to read different types of Forex charts can help you make informed trading decisions so you can maximize your profits.


Leave Reply