Trading in the foreign exchange (Forex) markets can be an exciting and potentially lucrative activity. To make the most of this activity, however, it is essential to understand the different types of charts that are available for analyzing market movements. By understanding these charts, traders can gain valuable insights into the movements of currencies and make more informed decisions when trading. In this article, we will take a look at some of the most common types of charts used in Forex markets, including line charts, bar charts, and candlestick charts. We'll discuss how they work and what information they can provide about the markets.
We'll also discuss how to read these charts and use them to your advantage when trading Forex. Forex traders rely on charts to identify patterns, make predictions and track their progress. Different chart types have different features and benefits that make them better suited to different types of analysis. This article outlines the various types of charts used in Forex trading and how to make the most of them.
Line Charts
are the most basic type of chart used in Forex trading. They plot a series of data points that connect to form a line.Line charts are mainly used to show the overall direction of a currency pair or other asset over a period of time, as well as the trend it is following. While line charts are simple to read and understand, they don't provide much detail about the price action within each data point.
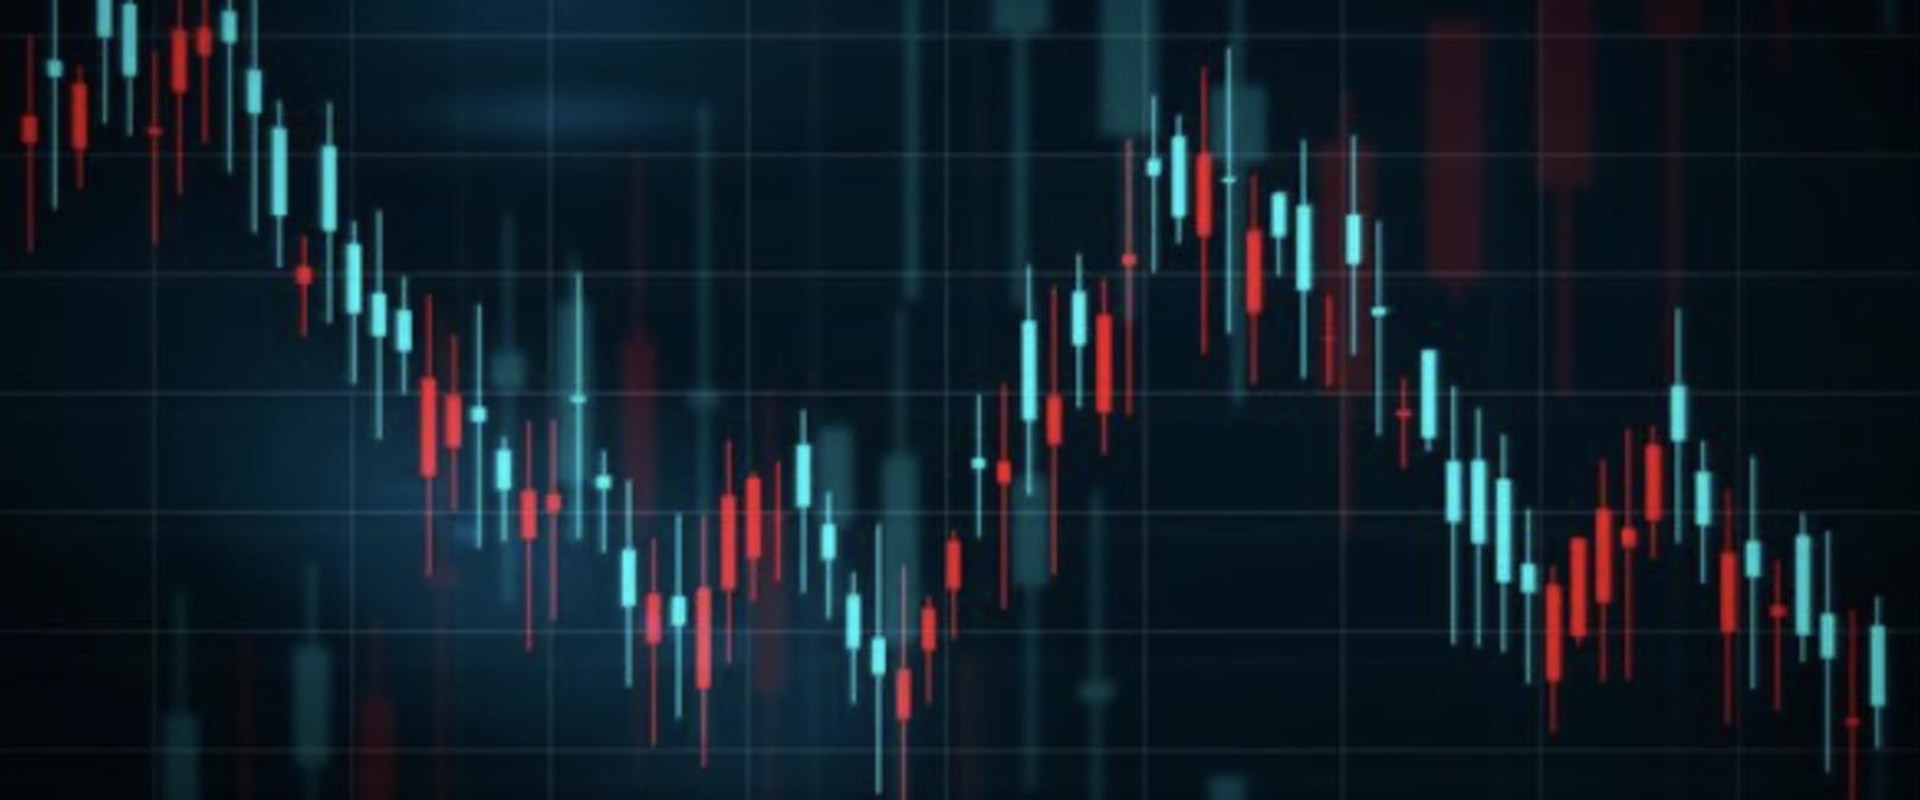
Candlestick Charts
are a type of charting tool used to visualize the price action of a currency pair or other asset. They are composed of individual candles, which represent the opening, high, low and closing prices of the currency pair over a period of time. Candlestick charts provide more information than line charts, such as the range of price action and whether the currency pair is trending or not.They are also useful for identifying support and resistance levels.
Bar Charts
are another type of charting tool used to visualize the price action of a currency pair or other asset. They are composed of individual bars, which represent the opening, high, low and closing prices of the currency pair over a period of time. Bar charts provide more detail than line charts, such as the range of price action and whether the currency pair is trending or not. They are also useful for identifying support and resistance levels.Renko Charts
are a type of charting tool used to visualize the price action of a currency pair or other asset.Unlike traditional charting tools, Renko charts use a fixed block size instead of traditional time frames. This helps traders identify strong trends in the market by removing some of the noise associated with traditional charting methods. Renko charts can also be used to identify support and resistance levels.
Kagi Charts
are a type of charting tool used to visualize the price action of a currency pair or other asset. They are composed of individual lines, which represent the open, high, low and close prices of the currency pair over a period of time.Kagi charts provide more detail than line charts, such as the range of price action and whether the currency pair is trending or not. They are also useful for identifying support and resistance levels.
Point & Figure Charts
are a type of charting tool used to visualize the price action of a currency pair or other asset. Unlike traditional charting tools, Point & Figure charts use a predefined box size instead of traditional time frames. Point & Figure charts can also be used to identify support and resistance levels. Each type of chart has its own features and benefits, as well as advantages and disadvantages.Line charts offer simplicity but lack detail, while candlestick and bar charts provide more detail but can be harder to read. Renko, Kagi and Point & Figure charts can be difficult to interpret but can help traders identify strong trends in the market. In order to make the most out of each type of chart in Forex trading, it is important to understand how each one works and how to read them correctly. Line charts can be read by simply looking at their direction over time, while candlestick and bar charts require more knowledge in order to interpret them correctly. Renko, Kagi and Point & Figure charts should be studied carefully in order to make full use of their features.
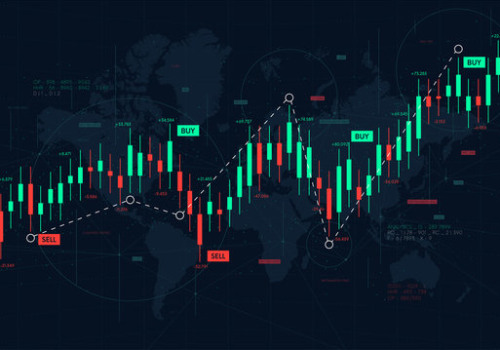
Candlestick Charts
Candlestick charts are one of the most popular chart types used in Forex trading.A candlestick chart is composed of individual bars which represent the opening, high, low and closing prices of a particular currency pair over a specific time period. Each bar is represented by a vertical line, with the thicker line in the middle representing the closing price. The thin lines on the sides are the opening and high/low prices. Candlestick charts provide traders with a visual representation of price action, and can be used to identify patterns and trends in the market.
Candlestick charts are particularly useful for identifying potential reversal points in the market. By looking at the size and shape of the candlesticks, traders can look for patterns such as dojis, hammers, and shooting stars which can indicate potential reversals or continuation patterns. Additionally, candlestick charts can be used to identify support and resistance levels as well as trendlines. Overall, candlestick charts provide traders with an in-depth look at price action over a given period of time.
By recognizing patterns and trends in the market, traders can use this information to make better-informed decisions about their trades.
Line Charts
A line chart is a type of chart used to display data points connected by a single line. Line charts are used to track changes over short and long periods of time. They are useful for observing overall trends and patterns, such as highs and lows, and can be used to make predictions based on past data. Line charts are often used in Forex trading as they allow traders to easily identify trends in currency price movements. Line charts can be used to spot changes in trends, identify support and resistance levels, and even measure the strength of a trend.In addition, traders can use line charts to identify key reversal points and potential entry and exit points. For example, a trader may use a line chart to identify an upward trend in a currency pair. This could indicate that the currency pair is likely to continue moving upwards, providing an opportunity for a profitable trade. On the other hand, if the line chart shows a downward trend, this could indicate that the currency pair is likely to move downwards, providing an opportunity for a short sale. Another example of how traders can use line charts is to identify potential entry and exit points. For example, if a trader notices that the price of a currency pair is trending upwards but has started to flatten out, this could indicate that the trend may soon change direction.
This could provide an ideal opportunity for the trader to enter or exit the position.
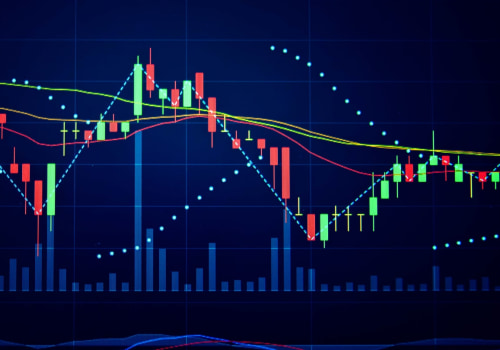
Bar Charts
Bar Charts are one of the most popular types of charts used in Forex markets. The bar chart is an effective tool for displaying the open, high, low, and closing prices of a currency pair over a period of time. Traders use bar charts to identify price trends, spot potential reversals, and develop strategies for entering and exiting trades. A bar chart is composed of vertical bars that represent the highs and lows of the price over a given period.The top of each bar represents the highest price traded during the period, while the bottom of the bar represents the lowest price traded. The left side of each bar represents the opening price, while the right side represents the closing price. By looking at the pattern of bars, traders can identify whether prices are trending up or down and spot possible reversals. Bar charts are especially useful for identifying support and resistance levels.
Support levels are areas where traders expect demand to increase, while resistance levels are areas where traders expect supply to increase. By looking at how prices have reacted to these levels in the past, traders can determine when it may be appropriate to enter or exit a trade. Bar charts are also useful for identifying patterns such as head and shoulders and double tops and bottoms. By looking at the pattern of bars on the chart, traders can identify potential opportunities for entering or exiting trades. Bar charts can also be used to identify patterns of volatility.
By looking at how wide or narrow the range of prices is during a particular period, traders can get an idea of how volatile the market is. This can help traders plan their strategies accordingly. In conclusion, there are several different types of charts used in Forex trading. Line charts, candlestick charts, and bar charts are the most common chart types used by traders. Each chart type has its own features and benefits and it is important to understand the different chart types and how to use them effectively for different types of analysis. Line charts are excellent for getting a simple overview of price movements, while candlestick charts provide more detailed information about price movements and market sentiment.
Bar charts are great for identifying patterns and can help traders make predictions and track their progress. By understanding the various types of charts used in Forex trading, traders can better utilize their charting tools to make more informed decisions.


Leave Reply