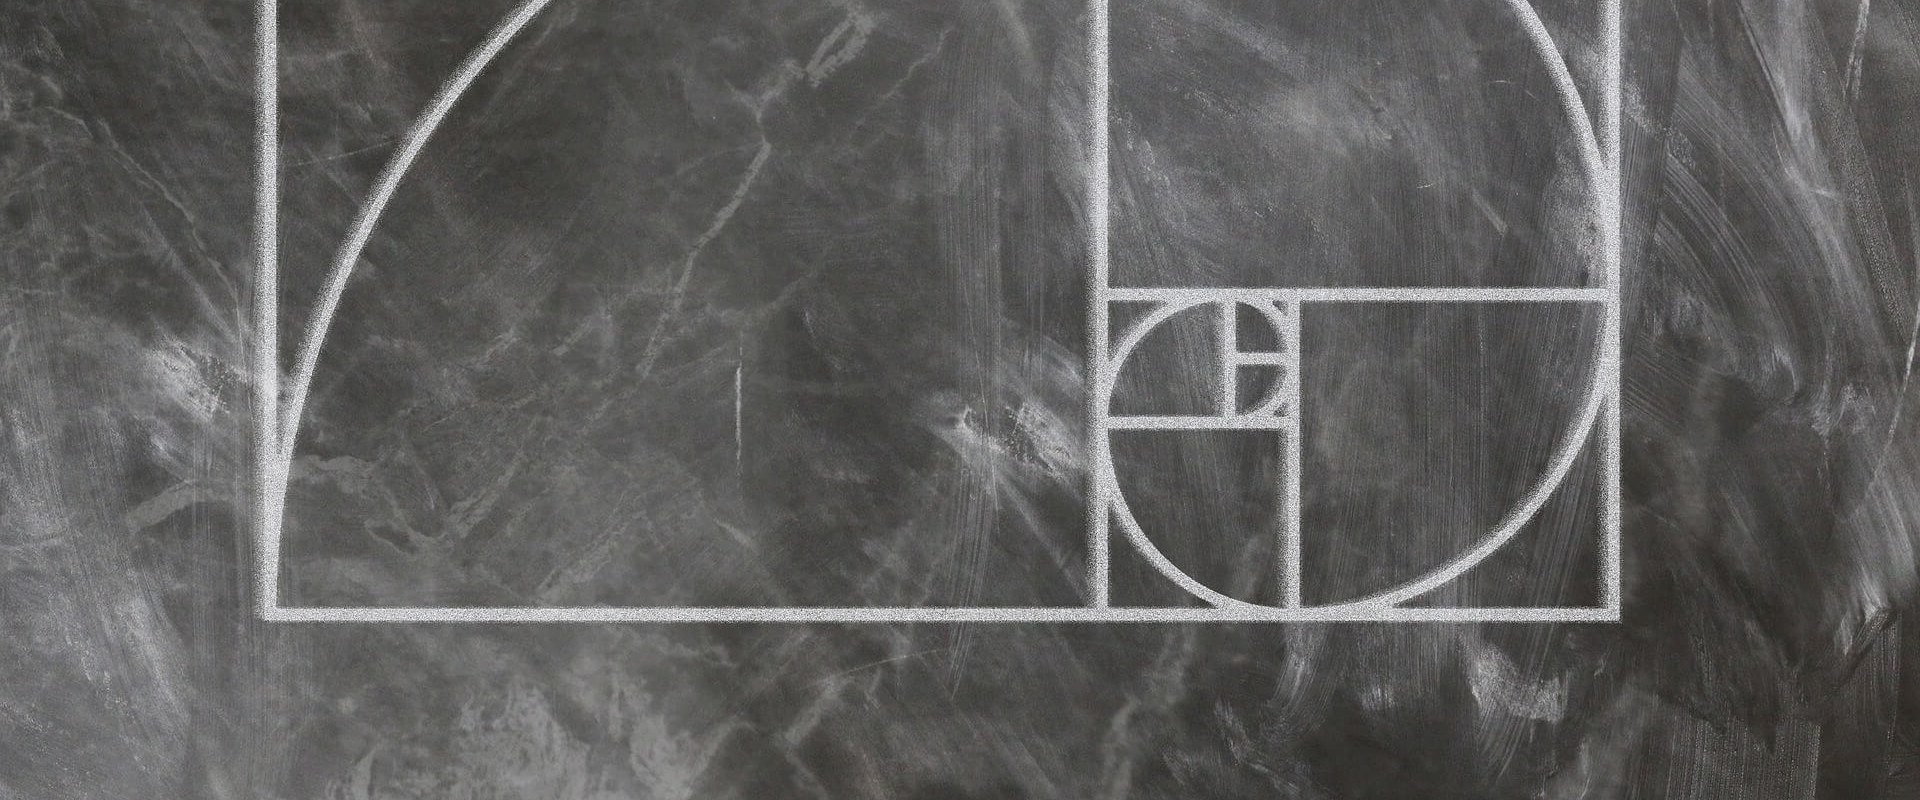
Fibonacci retracements are an important tool that can be used by traders and investors to identify significant levels of support and resistance. They are based on the Fibonacci sequence, a mathematical pattern that has been used for centuries in trading and investing. In this comprehensive overview, we will explain how to use Fibonacci retracements in Forex trading and how to identify critical levels of support and resistance. We will also discuss the various benefits of using this powerful tool and how it can be used to improve your trading results.
By the end of this article, you will have a solid understanding of how to use Fibonacci retracements for trading and investing. In this article, we’ll discuss what Fibonacci Retracements are, how they are used in the Forex markets, and how to identify potential entry and exit points. We’ll also provide examples of Fibonacci Retracements in action. First, let’s discuss what Fibonacci Retracements are. Fibonacci Retracements are a technical analysis tool that utilizes the Fibonacci sequence of numbers to identify potential reversal points in an asset’s price. The tool is used by traders to identify potential support and resistance levels based on the previous price movements.
Fibonacci Retracements are based on the idea that markets will retrace a portion of a larger move before continuing in the original direction. The Fibonacci sequence is used as a basis for these retracements, as it is believed that this sequence of numbers can help identify areas where a reversal may occur. To calculate Fibonacci Retracements, traders first identify the high and low points of the asset’s price over a certain period of time. They then divide the vertical distance between the two points with the key Fibonacci ratios of 23.6%, 38.2%, 50%, 61.8%, and 100%. These percentages represent the levels where traders may expect a possible reversal or continuation of the trend.
For example, if a trader identifies a high point of $100 and a low point of $50, they can then use the Fibonacci ratios to calculate potential support and resistance levels. By dividing the vertical distance between the two points by each of the key ratios, the trader can identify potential support and resistance levels at $77.63 ($100 - (23.6% x ($100 - $50))), $84.21 ($100 - (38.2% x ($100 - $50))), $90 ($100 - (50% x ($100 - $50))), $95.79 ($100 - (61.8% x ($100 - $50))), and $100 ($100 - (100% x ($100 - $50))).Traders can then use these levels as potential entry and exit points for their trades, as well as potential areas where a trend may reverse or continue. It is important to note that these levels are not exact entry and exit points, but rather areas where traders should be aware of potential reversals or continuation of trends. Let’s look at an example of Fibonacci Retracements in action. In this example, we will use a chart of EUR/USD from March 2020 to April 2020.
We can see that the pair has been in a strong uptrend since mid-March, with an initial high point at 1.1020 and a low point at 1.0520. Using the Fibonacci ratios discussed earlier, we can calculate potential support and resistance levels at 1.0783 (1.1020 - (23.6% x (1.1020 - 1.0520))), 1.0888 (1.1020 - (38.2% x (1.1020 - 1.0520))), 1.0970 (1.1020 - (50% x (1.1020 - 1.0520))), 1.1054 (1.1020 - (61.8% x (1.1020 - 1.0520))), and 1.1140 (1.1020 - (100% x (1.1020 - 1.0520))). We can see that the pair did indeed retrace towards each of these levels before continuing its uptrend, confirming that these are likely areas where traders should be aware of possible reversals or continuation of trends. In conclusion, Fibonacci Retracements are an important tool for traders looking to identify potential entry and exit points, and predict trends in the Forex markets. By understanding how these retracements work and how to identify potential support and resistance levels using the Fibonacci sequence, traders can improve their trading results.
Identifying Potential Support and Resistance Levels
Fibonacci Retracements can be used to identify potential support and resistance levels in an asset's price.Support and resistance levels are areas on a chart where the price of an asset tends to find support as it falls, or resistance as it rises. These areas can be used to identify potential entry and exit points in the Forex markets. To identify support and resistance levels using Fibonacci Retracements, traders will first need to identify a significant high and low in a currency pair's price. They can then plot a Fibonacci Retracement line between these two points and look for areas of potential support and resistance along the line. When the price of a currency pair reaches one of these areas, traders will take it as a sign that the price may reverse its current direction. It is important to note that while Fibonacci Retracements can be used to identify potential support and resistance levels, they are not always accurate.
Traders should use other forms of technical analysis in conjunction with Fibonacci Retracements in order to get a more accurate picture of the price movement of a currency pair.
Examples of Fibonacci Retracements in Action
Fibonacci Retracements are a powerful tool for traders to identify potential entry and exit points, and predict trends. By looking at the highs and lows of price action, traders can use Fibonacci Retracements to identify support and resistance levels, as well as potential price reversal points. To illustrate how Fibonacci Retracements can be used in real-world trading scenarios, let's look at an example. Suppose a trader is looking to enter a position in the EUR/USD currency pair.The trader uses Fibonacci Retracements to plot out the highs and lows of the price action on the chart. The trader then identifies a potential support level at 0.8200, which is a 50% retracement of the previous uptrend. The trader decides to place a buy order at 0.8200, expecting the price to rebound from this level. The trade turns out to be profitable as the market rebounds from 0.8200 and starts trending upwards again.
The trader can then use Fibonacci Retracements to identify potential exit points by plotting out the recent highs and lows. In this example, Fibonacci Retracements provided the trader with a useful tool for predicting potential entry and exit points, and helped them to identify a profitable trading opportunity. By combining technical analysis with Fibonacci Retracements, traders can take advantage of the market's movements and maximize their profits. Fibonacci Retracements are a powerful tool for traders looking to gain an edge in the Forex markets. By understanding the principles behind them and applying them correctly, traders can use these retracements to identify potential entry and exit points, as well as predict trends in an asset’s price.
With the right analysis and application of Fibonacci Retracements, traders can improve their trading results and gain a better understanding of the markets.


Leave Reply