
Forex trading can be incredibly lucrative, but it can also be incredibly risky. To make sure that you are successful in the Forex market, it is important to understand how to analyze price movements. In this tutorial, we will discuss the importance of analyzing price movements and provide tips on how to do it effectively. We will also explain how to use the various tools and strategies available for successful price analysis. Price analysis is an essential part of any successful Forex trading strategy.
By understanding and analyzing price movements, traders can better anticipate future market movements and make more informed decisions. With the right analysis, traders can identify key levels of support and resistance as well as potential entry and exit points. By having a better understanding of price movements, traders can also reduce their risk and increase their chances of success.
Analyzing Price Movements
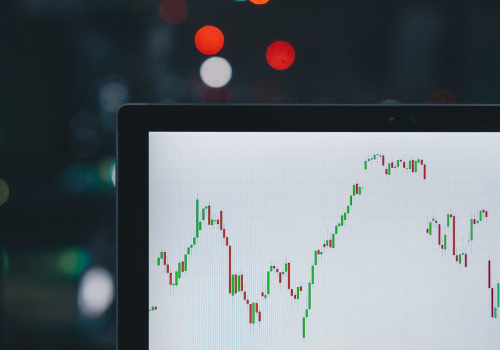
in Forex Trading is essential for any successful trader. Price movements in the Forex market are determined by a variety of factors, and understanding how to interpret and use these factors to make informed trading decisions is essential.In this tutorial, we'll cover the basics of analyzing price movements, including identifying trends, support/resistance levels, chart patterns, and more. One of the main tools used for analyzing price movements is identifying trends. A trend is a general direction in which prices are moving. Identifying trends can help traders identify opportunities to enter or exit positions.
Trends can be identified by looking at price charts and using certain indicators, such as moving averages and oscillators. Support and resistance levels are also important for analyzing price movements. Support levels are areas where prices have difficulty falling below, while resistance levels are areas where prices have difficulty rising above. Identifying these levels can help traders determine when to enter or exit positions.
Chart patterns are another important tool for analyzing price movements. Chart patterns can provide clues about the direction of future price movements. Common chart patterns include double tops, head and shoulders, and triangles. Analyzing these patterns can help traders determine when to enter or exit positions.
In addition to these technical analysis tools, it is also important to understand the underlying factors that influence price movements in the Forex market. These factors include economic and political events, currency values, supply and demand, interest rates, and more. By understanding these underlying factors, traders can gain insight into potential future price movements.
Having a trading plan
and proper risk management is also essential when trading currencies.A trading plan should outline a trader's objectives and how they intend to achieve them. It should include an entry strategy, an exit strategy, money management rules, risk management rules, and more. Risk management is important because it helps traders limit their losses when trades go against them. Finally, traders should also be familiar with technical analysis tools, such as moving averages, oscillators, and Fibonacci retracements.
These tools can be used to identify potential entry and exit points for trades. Moving averages can be used to identify trends, while oscillators can be used to identify overbought/oversold conditions in the market. Fibonacci retracements can be used to identify support and resistance levels in the market.
Identifying Trends
When analyzing price movements, it's important to identify trends. A trend is a general direction in which price is moving over a period of time.Trends can be up, down, or sideways, and can last for a few days, weeks, months, or even years. There are several ways to identify trends, including chart patterns, support/resistance levels, and moving averages.
Types of Trends:
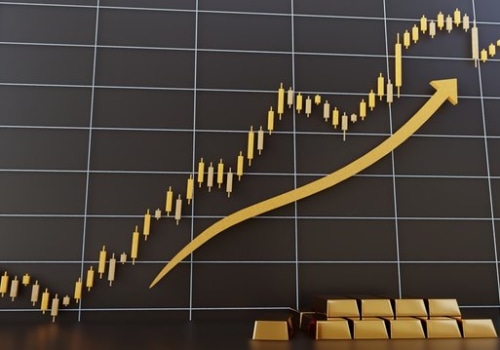
An uptrend is when the price of an asset is increasing over time. This is usually indicated by higher highs and higher lows on the chart. A downtrend is when the price of an asset is decreasing over time.This is usually indicated by lower highs and lower lows on the chart. A sideways trend is when the price of an asset is moving within a range. This is usually indicated by equal highs and equal lows on the chart.
Identifying Support/Resistance Levels:
Support and resistance levels are important points on a chart that indicate potential areas of reversals. Support levels are points where the price has previously found support and may not break through.Resistance levels are points where the price has previously faced resistance and may not break through. By identifying these levels, traders can use them to gauge potential turning points in the market.
Chart Patterns:
Chart patterns are another way to identify potential trend reversals. Common chart patterns include head and shoulders, double tops/bottoms, and triangles. These patterns can indicate when a trend may be reversing and provide valuable insight for traders.Understanding Risk
Risk management is an integral part of successful forex trading.It’s important to understand the various risks involved in trading and develop strategies to manage them. This includes knowing how to use stop-loss orders and other techniques to limit your risk. One of the biggest risks in forex trading is the risk of losing money due to unexpected market movements or bad trades. By understanding how markets move and why, traders can better prepare for the worst and plan for potential losses. This includes using stop-loss orders, which are designed to limit losses when prices move in an unfavorable direction. Stop-loss orders are placed at a predetermined price that is lower than the current market price.
When the market reaches this price, the order is automatically executed and the trader’s losses are limited. Traders can also use stop-loss orders to protect their profits by locking in gains when prices move in their favor. Another type of risk associated with forex trading is the risk of volatility. Volatility is a measure of how much prices can fluctuate over a given period of time. When volatility is high, prices can move significantly in either direction, making it difficult to predict which way they will go. To manage this risk, traders must be aware of current market conditions and be prepared to adjust their strategies accordingly.
They can also use technical analysis tools such as Bollinger Bands and moving averages to help identify potential opportunities and take advantage of them. Finally, traders should be aware of the risk of overtrading, which occurs when a trader takes on too many trades at once. This can lead to losses if the trader does not have a clear strategy or plan for managing their positions. To avoid this, traders should take only trades they are confident about and stick to their trading plan. By understanding how prices move and why, as well as the risks associated with forex trading, traders can better prepare for success. They can use stop-loss orders and other techniques to limit their risk while still taking advantage of potential opportunities in the markets. In conclusion, analyzing price movements is a crucial skill for any successful Forex trader.
Identifying trends, understanding risk, and having a trading plan are all essential components of any trading strategy. By learning how to properly analyze price movements, traders can improve their chances of making profitable trades. To further develop their knowledge and skills, traders can use a variety of resources such as online tutorials, books, and courses. Ultimately, trading the Forex market successfully requires a combination of technical and fundamental analysis. By learning how to analyze price movements, traders can gain an edge in the markets and become better equipped to make informed trading decisions.


Leave Reply