Are you looking to become a successful Forex trader? Understanding technical indicators is essential for any trader who wants to maximize their profits. Technical indicators are powerful tools that can be used to analyze market trends and make informed trading decisions. In this article, we will be discussing the basics of technical indicators and how they can be used to develop a successful trading strategy. We will also discuss some of the most popular technical indicators and how they can be used to analyze the markets.
By the end of this article, you will have a better understanding of technical indicators and how they can be used to improve your trading performance.
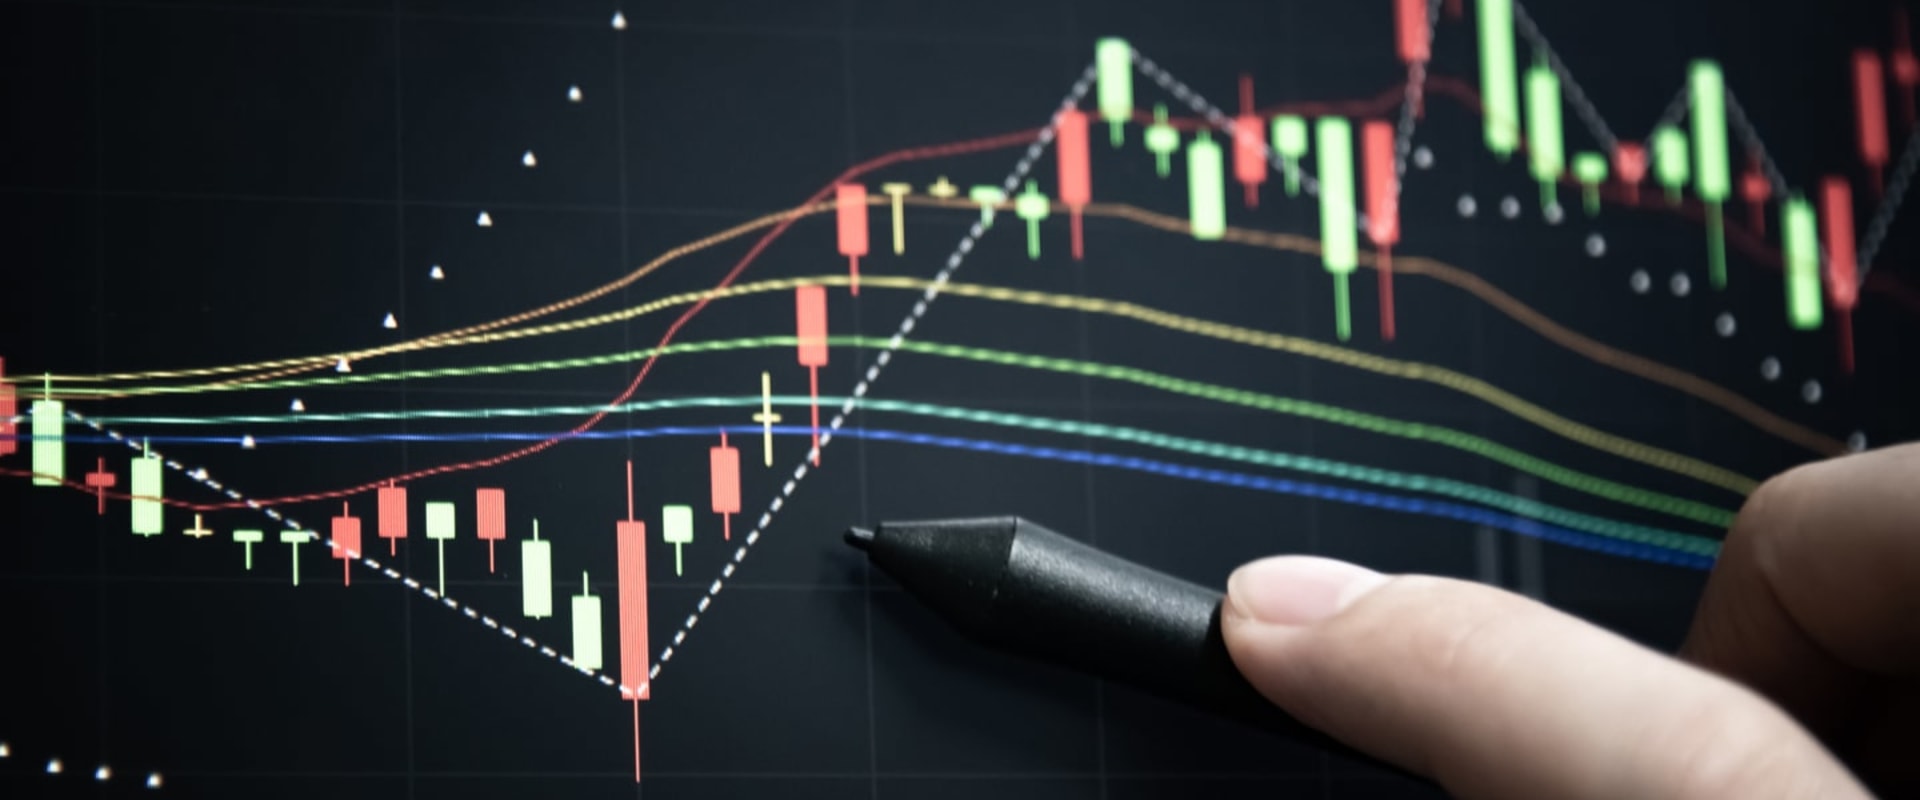
Technical indicators
are mathematical calculations used to analyze market data, such as price and volume. These calculations are used to generate buy and sell signals for traders. There are many different types of technical indicators, each with its own unique calculation. Some of the most popular technical indicators include Moving Averages (MA), Relative Strength Index (RSI), Bollinger Bands (BB), and Stochastics.Each of these indicators has its own unique properties and can be used to identify potential trade opportunities. When selecting a technical indicator, it's important to consider the type of analysis you want to perform. For example, Moving Averages are best used for trend analysis, while RSI is best suited for determining overbought and oversold conditions. Additionally, different indicators may be more suited for different time frames. For example, a longer-term indicator such as Bollinger Bands may be better suited for long-term traders, while a shorter-term indicator such as Stochastics may be better suited for short-term traders. When using technical indicators, it's important to remember that they should not be relied upon exclusively for making trading decisions.
Instead, they should be used in conjunction with other forms of analysis such as fundamental analysis and price action analysis. Additionally, it's important to be aware of the potential pitfalls of using technical indicators, such as false signals and whipsaws. False signals occur when a trading signal is generated but the price does not move in the predicted direction. Whipsaws occur when a trading signal is generated but the price quickly reverses in the opposite direction. Finally, it's important to remember that no single indicator is perfect and that all indicators have their own strengths and weaknesses.
It's important to select the indicators that best suit your trading style and risk tolerance. For example, some traders may opt to use Moving Averages for trend analysis while others may prefer RSI for overbought/oversold conditions. By understanding how to use technical indicators effectively, traders can gain an edge in the markets and maximize their profits. Technical indicators can be used on any timeframe and can provide valuable insights into market movements that may not be visible by just looking at price action alone.
Potential Pitfalls of Technical Indicators
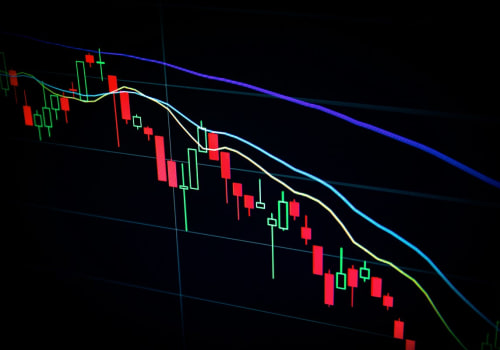
Technical indicators can be an invaluable tool for traders when used correctly. However, it's important to be aware of the potential pitfalls of using technical indicators, such as false signals and whipsaws.False signals occur when an indicator gives a buy or sell signal, but the resulting price movement does not match the signal given. This can cause traders to enter positions they should not have and experience losses. Whipsaws are another common issue with technical indicators. A whipsaw is when a price moves in one direction and then quickly reverses and moves in the opposite direction. This can cause traders to take positions based on false signals, leading to losses.
It is important for traders to be aware of these potential pitfalls and use technical indicators wisely in order to maximize profits.
Using Technical Indicators Effectively
When using technical indicators, it's important to remember that they should not be relied upon exclusively for making trading decisions. Technical indicators can provide valuable insights into market movements, but they should only be one part of a broader trading strategy. Before using technical indicators, traders should determine their risk appetite and time horizon. This will help them determine which indicators are best suited for their particular trading style.It's also important to understand the parameters of each indicator so that they can adjust it to fit their individual needs. It's also important to remember that technical indicators are lagging indicators. This means that they will only provide signals after a move has already occurred in the market. As such, it's important to use other forms of analysis to confirm the signals given by technical indicators.
Finally, traders should use a combination of different technical indicators in order to increase the accuracy of their trades. Combining different technical indicators can help traders identify potential entry and exit points more precisely and can help them reduce the risk associated with trading.
Types of Technical Indicators
When selecting a technical indicator, it's important to consider the type of analysis you want to perform. Some of the most popular technical indicators include Moving Averages (MA), Relative Strength Index (RSI), Bollinger Bands (BB), and Stochastics. Moving Averages are used to identify a trend's direction by smoothing out price fluctuations.The Relative Strength Index is a momentum oscillator used to measure the magnitude of price movements. Bollinger Bands are volatility bands placed above and below a moving average, and are used to identify potential trading opportunities. Finally, Stochastics measure the momentum of a trend by comparing a security’s closing price to its price range over a given period of time. Each type of technical indicator has its own advantages and disadvantages, so it’s important to select the one that best suits your needs. For example, Moving Averages are great for identifying trends, but they do not always provide accurate entry and exit points.
On the other hand, Stochastics can provide more accurate entry and exit points, but they tend to be less reliable in identifying trends. In conclusion, technical indicators can be a valuable tool when used correctly in Forex trading. However, it's important to remember that no single indicator is perfect and that all indicators have their own strengths and weaknesses. By understanding the various types of technical indicators, how to use them effectively and the potential pitfalls to watch out for, traders can gain an edge in their trading.


Leave Reply