
Technical analysis is a powerful tool used by financial traders to evaluate and predict future market movements. By analyzing past price movements and trends, traders can gain insight into potential future price movements. Technical analysis is often used in conjunction with other trading strategies, such as fundamental analysis or sentiment analysis, to form a complete trading system. In this article, we will provide a comprehensive overview of technical analysis and its various components. We will explain the key concepts of technical analysis, such as chart patterns, technical indicators, and candlestick analysis.
We will also discuss the different types of technical analysis techniques, such as trend analysis, oscillator analysis, and volume analysis. Finally, we will explore how traders can use technical analysis to develop their own trading strategies and improve their trading results.
Technical Analysis
is a tool used by traders to analyze and interpret market data in order to make informed trading decisions. It is a form of technical analysis that uses past market data to identify patterns and trends, which can then be used to predict future market movements. Technical analysis can be used in combination with other forms of analysis, such as fundamental analysis, to give traders a more holistic view of the markets and make more informed trading decisions. The main components of technical analysis are trend lines, support and resistance levels, chart patterns, indicators, and oscillators.Trend lines are used to identify the direction of a trend and when it may be ready to reverse. Support and resistance levels are used to identify levels where the price may find resistance or support and bounce back. Chart patterns are used to identify potential turning points in the market and provide insights into the market sentiment. Indicators and oscillators provide additional information about the strength of the trend and potential reversals. Trend lines are one of the most commonly used tools in technical analysis.
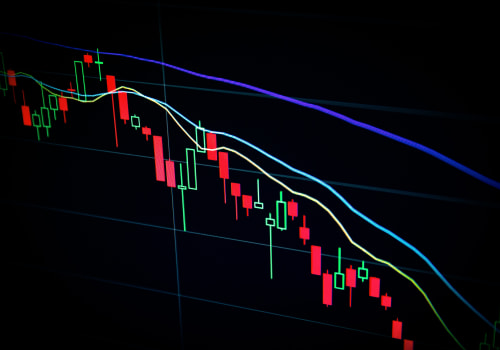
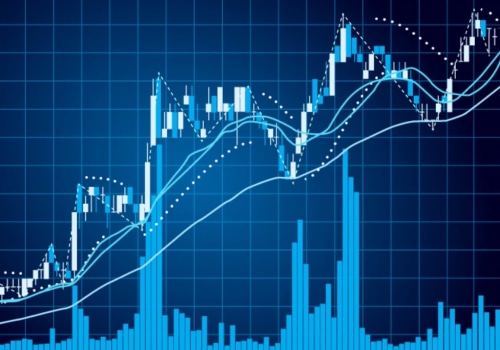
They are drawn on a chart to identify the direction of a trend and potential points where the trend may reverse. A trend line is drawn by connecting two or more points on a chart. If the trend line is sloping upwards, this indicates an uptrend, while a downward sloping trend line indicates a downtrend. Trend lines can be used to identify potential entry and exit points in the market. Support and resistance levels are another important component of technical analysis.
These are levels on a chart where the price may find support or resistance and bounce back. Support levels indicate a level at which the price is likely to find support and not fall below it, while resistance levels indicate a level at which the price is likely to find resistance and not rise above it. Support and resistance levels can be used to identify potential entry and exit points in the market. Chart patterns are another important component of technical analysis. These are patterns that form on a chart that can be used to identify potential turning points in the market.
Common chart patterns include head and shoulders, double tops, and double bottoms. These patterns provide insights into the market sentiment and can be used to identify potential entry and exit points in the market. Indicators and oscillators are also important components of technical analysis. These are tools that provide additional information about the strength of a trend or potential reversals. Popular indicators include moving averages, relative strength index (RSI), stochastic oscillator, MACD, and Bollinger Bands.
Oscillators provide additional information about possible overbought or oversold conditions in the market. Technical analysis is an important tool for traders that can be used in combination with other forms of analysis to gain more insights into the markets. By using trend lines, support and resistance levels, chart patterns, indicators, and oscillators, traders can gain valuable insights into the markets and make more informed trading decisions.
Chart Patterns
Chart patterns are an important tool used by traders to identify potential turning points in the market. They provide insight into the sentiment of the market by showing whether buyers or sellers are in control. Chart patterns can be used to identify trend reversals, trend continuations, and breakouts.Common chart patterns include head and shoulders, double tops and bottoms, triangles, wedges, flags, and pennants. Head and shoulders patterns are considered bearish reversal patterns that signal the end of an uptrend. Double tops and bottoms indicate a reversal of the current trend. Triangles are used to predict a breakout in either direction.
Wedges and flags are continuation patterns that signal a trend is likely to continue. Pennants are used to predict an upcoming breakout in the direction of the previous trend. Chart patterns can be used in combination with other forms of technical analysis, such as volume or momentum indicators, to help traders make more informed trading decisions.
Trend Lines
Trend lines are a tool used by traders to identify the direction of a trend and predict when it might be ready to reverse. They are typically drawn on a chart by connecting two or more points on the price action. The angle of the trend line can provide traders with insight into the strength of the trend; a steep angle indicates a strong trend while a shallow angle indicates a weak trend.Trend lines also provide potential areas of support and resistance that can be used to enter or exit trades. For traders to draw effective trend lines, it is important to identify two or more points on the chart that can be connected. These points can be used to determine the slope of the trend line and determine whether the trend is strong or weak. Additionally, these points can also indicate areas of support and resistance where the price may reverse. Once drawn, traders can use trend lines to identify entry and exit points in the market. If the price is trending lower and approaching a trend line, traders may look to enter short positions as the price may reverse at this level.
Conversely, if the price is trending higher and approaching a trend line, traders may look to enter long positions as the price may reverse at this level.
Support & Resistance Levels
Support and resistance levels are important areas on a chart that show where the price may find support or resistance and bounce back. These areas are usually identified by looking for previous highs and lows on the chart. Support levels are areas where the price has previously found support and is likely to do so again, while resistance levels are areas where the price has previously found resistance and is likely to do so again. The purpose of identifying support and resistance levels is to identify potential entry and exit points for trades. By recognizing when a price has previously found support or resistance at a certain level, traders can be better prepared to enter or exit a position.Technical analysis can help traders identify these levels more accurately, as well as predict when a support or resistance level may break. Support and resistance levels can also be used to identify potential trend changes. If the price breaks through a support level, it is often an indication that the current trend is reversing. Similarly, if the price breaks through a resistance level, it may be a sign that the trend is continuing.
Indicators & Oscillators
Indicators and oscillators are technical tools used by traders to analyze and interpret market data for making informed trading decisions. They provide additional information about the strength of a trend or potential reversals in the market.Common indicators used in technical analysis include moving averages, relative strength index (RSI), stochastic oscillator, MACD, etc. Moving averages are one of the most widely used indicators and show the average price of a security over a certain period of time. They are trend-following indicators that can help traders identify entry and exit points for a trade. The relative strength index (RSI) is an oscillator that measures the speed and magnitude of price changes and is used to identify overbought and oversold conditions. It also helps traders identify potential reversals in the market. The stochastic oscillator is another popular indicator used to identify momentum and potential reversals in the market. It compares the closing price of a security to its price range over a certain period of time. Finally, the Moving Average Convergence Divergence (MACD) is an indicator that measures the difference between two moving averages, typically a short-term and a long-term moving average.
It is used to identify potential buy and sell signals. Technical analysis is an essential tool for traders, as it provides them with valuable insights into the market sentiment and potential turning points. It incorporates a wide range of elements such as trend lines, support and resistance levels, chart patterns, indicators and oscillators to provide traders with a comprehensive overview of the markets. Technical analysis can be used in combination with other forms of analysis, such as fundamental analysis, to give traders a more holistic view of the markets and make more informed trading decisions.


Leave Reply